Price It In Gold
The gold panic that's gripped the public worldwide may be a response to the normalization of 'money printing' - a.k.a. 'inflation'.
The general public is not privy to the inner workings of the people that control central bank policies, but we have had enough of watching our savings being inflated away at an increasingly fast pace ... fast enough that traditional investments cannot hope to compete with how quickly the 'unit of account' in each country is being devalued.
The result is predictable:
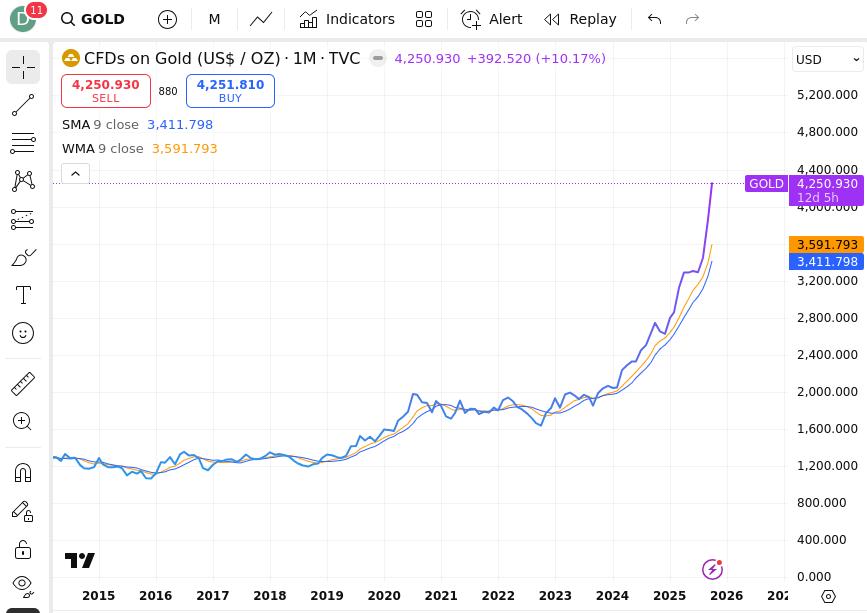 Gold Price Chart Parabola
The price of gold has now gone parabolic in response, and there is no evidence that the central banks have any plans to cease printing money.
Those in crypto - and in trad fi as well - have two options:
- Continue to study charts of fiat-denominated value, or
- Learn to 'chart in gold'
The reason, in theory, is that, while governments and central banks can inflate away the value of fiat currencies, they cannot easily control the supply of gold. Because of this, many traders - including me - have learned how to 'chart in gold' rather than in fiat denominated value.
And the results of these charts are revealing.
One Example: Bitcoin
The ups and downs of Bitcoin are the most high-profile topic in cryptocurrency. Because the headlines belong to the first mover of crypto, we can use it as an example.
If you depend on USD as the 'unit of account', the all-time high appears to be around September 29th of this year:
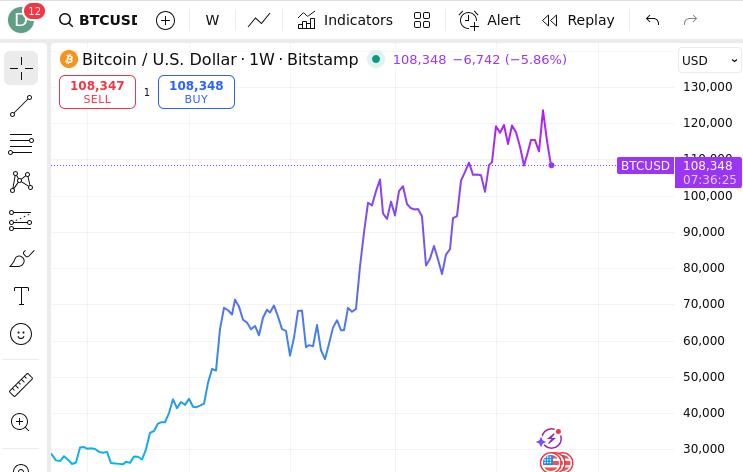 BTC Denominated In USD
But ... if you chart it in 'ounces of gold', it's apparent that the all-time high (denominated in gold) was set around December 9th, 2024:
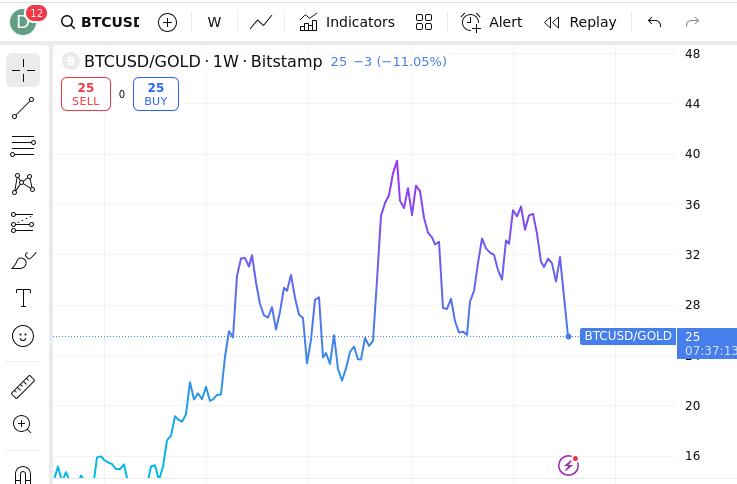 BTC Denominated in Gold
Some traders will interpret the charts differently based on the dramatic difference when denominated against gold; which may account for the fact that a significant portion of crypto traders have now opted to take a defensive posture, rather than assuming that the bull market will continue unabated.
Maybe.
Now Do Silver! 😅
On XRPChat (the social website) long ago, I was struck by how many 'silver bugs' were there!
Now, in 2025, I think I understand. Silver, like gold, is facing some shocking levels of popularity. If we want to 'chart in silver', the technique is identical. Let's take BTC again, and measure it in 'ounces of Silver':
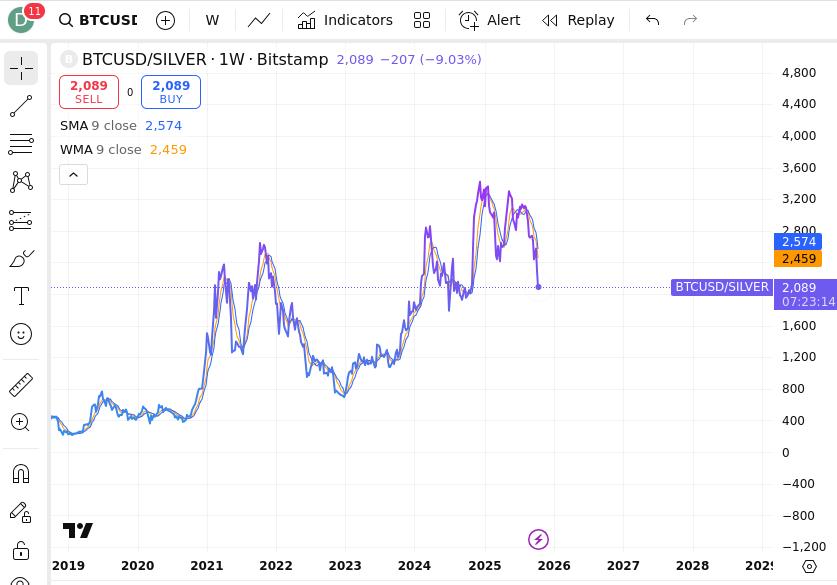 BTC Denominated In Silver
Now Do XRP!
While my favorite cryptos are listed on my 'X' profile for all to see, I'll just pick the one with the highest volume, and take a closer look; XRP.
Here is the XRP chart denominated in 'ounces of gold':
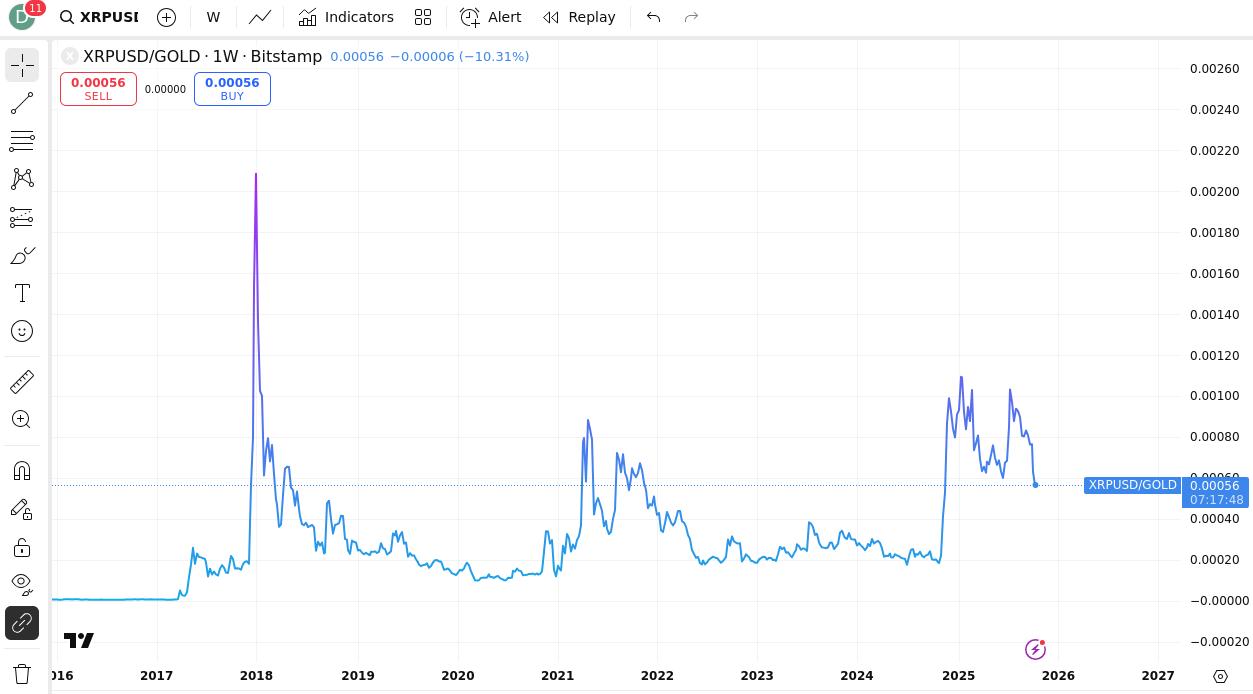 XRP Denominated In Gold
After switching to denomination in 'ounces of gold' for XRP, I was struck by the dramatic difference. The all-time high in 2018 was not even remotely approached when measured in gold. While the USD-denominated rallies in 2025 were impressive, they look very different in this context.
Like the first mover - BTC - XRP is also seeing recent declines due to a combination of gold's parabolic rally, along with what may be a natural exhalation of exhausted crypto traders.
What The Future Holds
Nobody knows when the current gold rally will abate and establish a new plateau of gold prices. Until then, it may be a revealing practice to review the performance of (both) trad-fi and neo-tech assets against this precious metal.
At some point, the charts will change.
The key to being a successful trader of crypto is to know when to rotate money back into the assets you're attempting to accumulate. Unfortunately, I do not have a crystal ball, and am studiously watching the charts just like everybody else!
How YOU Can Chart In Gold
On any 'tradview' chart - and most third party sites that use their software - you can denominate in gold by doing the following steps:
-
Click in the 'asset' that is being charted.
-
In the entry box, specify "/GOLD"
-
In the entry box, specify "/SILVER" if you prefer
With only that simple change, you will now see your favorite crypto (or other asset) denominated in ounces of gold (or silver).
Caveats
While I really enjoy Tradeview charting with their tools, I do not know the specific techniques for where they get all of their data.
In addition, when I chart in gold or silver, I do some approximate estimates to make sure it's using what I expect. The numbers on the right side of a chart can be significantly different if you're using another charting method, such as 'algorithmic', for example, or if you change the 'unit of precious metal' to grams instead of ounces.
In addition, I make no claims on the shape of the charts in this article, and I do not make any claims about what the future holds; these charts are reflective of historical prices to this point (October of 2025).
Always DYOR when it comes to charting!
Don't Be Fooled
Some may argue, legitimately, that the price of gold is too volatile to use as a unit of account. And if the price increases we're seeing reflect more of a temporary frenzy than a sustained increase in the precious metal's price, they may be correct.
But double-checking your charts with this approach seems to be a valid data point in market evaluations, and we've seen some - both - bullish and bearish charts not resolve the way in which we'd expect over the last few months.
Perhaps there's something to measuring our favorite assets against the age-old standard of value storage; physical gold.