Xahau Tokenomics: Coin Supply
Tokenomics is a general term given to the supply characteristics of a crypto network.
It refers, generally, to the supply of a token over time, and in context, usually pertains to the distributed supply as compared to the total supply.
Each network sports its own supply numbers, and lists those numbers on coinmarketcap and coingecko, and other analysis sites. We can do some simple math and comparisons ... some of which are worth considering.
Supply Of Networks
The supply of some popular networks:
- BTC: 21 million coins - 20 million in circulation
- ETH: 121 million coins - 121 million in circulation
- XRP: 100 billion coins - 59 billion in circulation
- FLR: 104 billion coins - 72 billion in circulation
These numbers serve as a benchmark for evaluating other networks, and can provide some background for understanding how the market perceives their value, relative to supply.
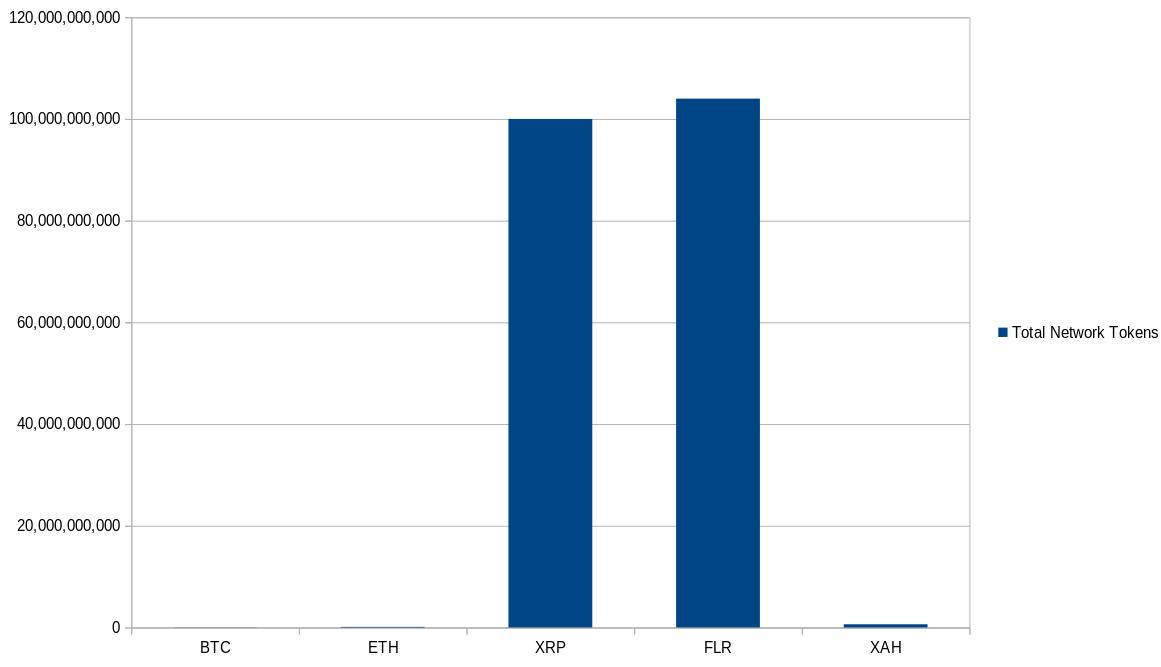
So how does Xahau, the 'smart contract' version of the XRP Ledger, stack up against these other networks in terms of supply? The total numbers are depicted in the following chart:
 Visual Token Supply
- XAH: 633 million coins - 267 million in circulation
Ownership Percentages
Another way to evaluate tokenomics when comparing networks, is to determine how much of an 'ownership percentage' that $10,000 dollars can purchase.
That's a lot of money; but to truly evaluate the differences in ownership percentage, I'm choosing to use a large amount of fiat currency to demonstrate the differences between the networks.
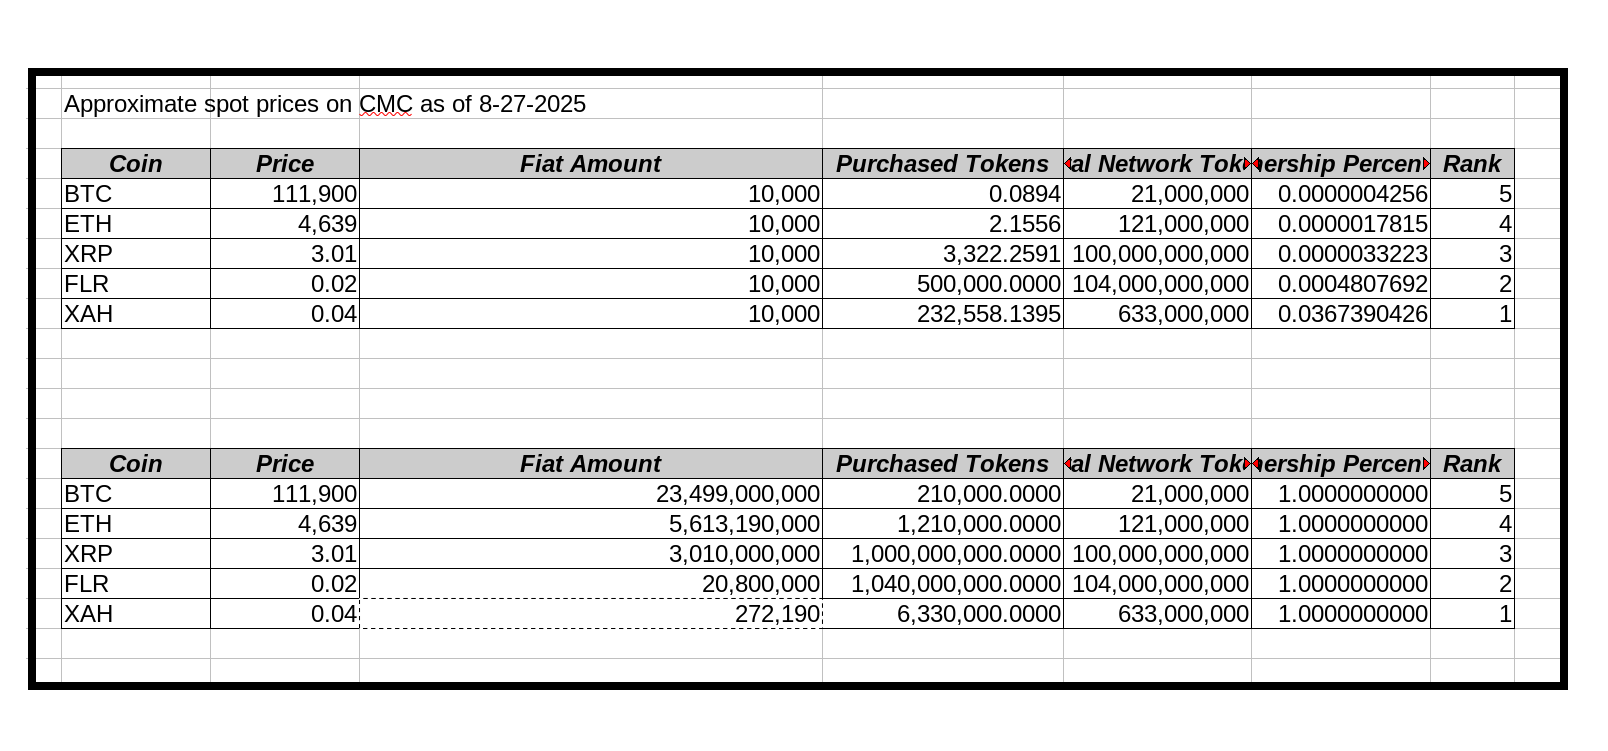
How it works: We are going to see 'what percent of the network that ten thousand dollars can purchase', given current market prices. We'll divide the number of tokens we can purchase with that $10,000 by the total amount of tokens in that network, and ignore 'distributed' metrics for this comparison:
- BTC: 0.0000004256 % of the network
- ETH: 0.0000017815 % of the network
- XRP: 0.0000033223 % of the network
- FLR: 0.0004807692 % of the network
- XAH: 0.0367390426 % of the network
To make the comparison even more dramatic, we can look at it from another perspective, and ask a question, instead:
"What amount would I need to spend, to own 1% of the supply?"
Answer:
- BTC: $ 23,499,000,000
- ETH: $ 5,613,190,000
- XRP: $ 3,010,000,000
- FLR: $ 20,800,000
- XAH: $ 272,190
😲 The first answer is shocking, given BTC's relatively recent ascent since its creation in 2008: it would cost you over 23 billion dollars (that's billion with a 'B'!) to acquire only 1 % of the outstanding supply of that network at current prices.
Likewise, we see large amounts listed for the others used in the comparison; but with XAH, we arrive at an amount that is well within range of some large speculators!
For a comparatively smaller amount of USD-denominated value, a 🐋 'whale' speculator could acquire a very large portion of the Xahau network at current prices.
Summary
Examining tokenomics allows stakeholders to understand the underlying economics of a cryptocurrency network, from the standpoint of supply. This is important to speculative markets, and these numbers can identify surprising differences when a person researches various coins on sites like coinmarketcap or coingecko. While not a guarantee of price, market cap, or ranking, it is a valuable metric when evaluating a digital asset.
In the case of the new Xahau network, that difference in XAH tokenomics remains a dramatic, noteworthy point, when placed against other, established players in the general 'crypto' space.
X>
Sources:
https://xahau-treasury.xrpl-labs.com/
Coin comparison:
 Coin Comparison Math


